
Churn, or lost customers, is something all businesses are interested in preventing. Because it costs between five and twenty-five times more to acquire new customers than to retain existing ones. Source (Harvard Business Review).
The simple definition of churn is calculated by dividing the number of customers who have cancelled their subscriptions or stopped buying products within a given time period by the number of active customers at the beginning of the same time period. This simple analysis provides great value as it can be used as a benchmark when comparing the significance of your more advanced predictive models. And finding out how churn rates change over time or product groups can be used to focus on given customer segments. In this article we delve deeper and examine predictive churn analysis that provides even greater value.
Predictive churn analysis
Churn usually needs to be broken down to a more detailed level as customers’ behaviour and preferences vary, which is reflected in how satisfied they are or how much they want to move on to a competitor. This is where predictive churn analysis comes in.
The probability of churn can be calculated using several statistical or machine learning methods. The methods process historical customer activity and behavioural data to calculate the probability of churn per customer.
Where to start?
To build a successful predictive churn model, a clear use case is required first of all. Not only to determine who will use the model’s results and why, but also to help data scientists with the choice of methods.
Areas of application
- Creating Churn Risk Scorecards that can indicate who is likely to leave, and use this information to run retention campaigns
- Predicting the likelihood of churn and using the results to flag customers for future email campaigns
- Integrating results from the churn model with internal applications that customer service uses to share churn results with customer service and customer service collects customer behaviour for the churn model.
- More on areas of application in this article, 7 ways to benefit from a churn analysis.
Customer data
As churn analysis is based on statistics and history it is not suitable for start-ups that have not yet built up customer volume, but rather for medium-sized and large companies that have been in the market for a few years.
Execution
1. Export data
The first step is to export historical customer data from customer service as a dataset. Customer data is often stored in a CRM system or in a database from a Data warehouse, where each unique customer has a customer ID.
2. Prepare the dataset for analysis
It is common for customer data to be located in different places and therefore needing to be retrieved from different data systems and merged. This can often be done in Excel or SQL. The dataset may be missing values, have incorrect values or mix data types, so the dataset needs to be cleaned and structured before it can be used for churn analysis.
Table 1: Examples of datasets.
| Customer | Churn | Gender | Age | Number of months as a customer | Product Group |
| 10001 | Nej | Mand | 23 | 14 | Stor |
| 12001 | JA | Kvinne | 38 | 5 | Mellen |
| 10021 | Nej | Mand | 56 | 43 | Lille |
3. Choosing Churn Analysis Tools
Several tools for churn analysis are available in the market. From more graphical interfaces like Microsoft Machine Learning Studio and Alteryx Designer, to more script-based tools like Python and R-Studio.
4. Choosing a method for churn analysis.
A churn analysis can be done with several different statistical methods such as Logistic Regression, Decision Tree or Gradient Boosting algorithm. Present your use case to a data scientist or advanced analytics consultant to discuss which methods to use.
Tips! Test several different statistical methods to compare the best model and outcomes.
5. Train and test the model
Break down your dataset into a subdataset to train your model, and a second subdataset to test your model and validate it against new data not used to train the model. A common breakdown is that 80 percent of the rows are used to train the model and the remaining 20 percent are used to test the model. The breakdown shall be done randomly. Build a model that you train using your dataset. In your model, which you can build in Machine Learning Studio or Alteryx, you choose statistical methods that you can compare against each other. Feel free to ask a data scientist or BI consultant for help when building your model.
6. Interpret the result and iterate the model
You can often get the result from your model as an ROC curve where you want to achieve a high True-Positive rate and a low False-positive rate.
Figure 2: ROC curve, Source: Towards data science.
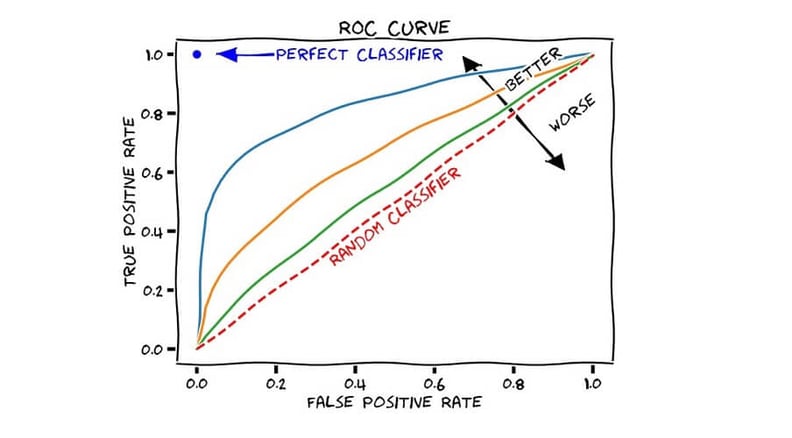
Figur 1:ROC-kurva, Källa Towards data science.
Advice ahead of your first churn analysis
Are you interested in getting started with churn analysis? Feel free to contact us at Random Forest so we can tell you more about Machine Learning Studio or Alteryx and what to consider with regard to your dataset and model to build. For more on churn analysis with Alteryx, watch our recorded webinar below.
Joakim Rydén SjöstrandJoakim Rydén Sjöstrand arbejder som Business Intelligence-konsult i Random Forest. Han har arbejdet med at udføre Business Intelligence-løsninger og har også mangeårig erfaring som forretningsanalytikere. |